Companies & their audience

http://www.nielsen.com/uk/en.html

Nielsen

  • Task 1:-
    • On your blog ( and in your own words) explain what  the company does.

Nielsen is a media company that helps other business companies succeed in advertising their product or themselves to the right consumers. They go into deep research to help those businesses understand the audience and the behavior that the audience has. Nowadays, Nielsen is known for having two analyses:  the interest the consumers have in particular TV/films and the products they like to buy.

  • Task 2:- Look at the part of the site ‘practices and measurements menu’
    • What services are offered by Neilsen?

On the Nielsen website there is a page that explains more on the service in which the media research company provides for their costumers. Here are three examples of their services:

  1. Consumer Neuroscience: This is where the website offers research in the nature of business. They measure copy testing, Ad compression, package testing, In store testing, Brand es sense and Total consumer experience. So, it’s not nature as mother nature but nature of marketing and business companies. They use two techniques to go forth with their research which are eye-tracking sensors and EEG (electroencephalography).
  2. Retail: For this one, the company researches on the profit and items consumers buy, and their behavior. They do this by using their retail expert insight, scanning cash registers, gathering marketing information (e.g. distribution), behavior of company to consumer and etc. This is all research that neilson provides for retail as it gives as much for the companies to know what matters to the consumer and have success in their business.
  3. Mobil: The research into the success of technology and it’s interest for consumers. They go into two types of research: Deploying On-Device Meters to measure smartphone activity, and Surveying mobile consumers via telephone, in-person and online surveys. The research company goes onto saying they are the best in  researching as they go into “depth” and “breadth”.

These services don’t seem to have prices (from looking around the site) except retail (under retail measurements). If you go on that there are suggestion to even more specific things to do with retail. If you go to the health and beauty aids, go onto UK section and the cheapest research they offer is for acne remedies in the UK at the price of 2,8000.00 euros. Just from the title you can tell that the research company goes into detail on specific things, in this case beauty products. The content of this type of research includes File type, facts, products, markets and periods. This is a good price for the type of research as they include periods meaning research over time, so the money is being spent on the time the research company takes to research on anti acne products.

In conclusion, Nielsen would be the best consumer research company for other media companies that want success in either themselves or their product(s) or both. Reason one is for those massive media companies who are already successful from the outcome of their selling & marketing to their consumers, to keep the achievement up and for it to grow, having Nielsen would make the company grow bigger and bigger as they update their research on consumers as regularly as possible so then their costumers are getting the latest modern trend that alerts the right consumers for them.

Second reason is because these other media companies might not have anyone in the professional field of researching the right, so they need a company to do it for them. It’s about not taking the risk of hiring someone who knows a little about right consumers for companies, when a whole company would know more. It is also about time more people can get the research done quicker than one person, so the companies that hire Nielsen would have the research in a matter of days.

And for those companies who want to become like the massive and successful need all the help they need to become those things and gain profit, if not then it can all go down hill.

Audience Grouping

From the site think box (http://www.thinkbox.tv/server/show/nav.914) they have specific groups for TV audiences: Adult, Women, Men, Housewives & Children. This site already put it’s groups demographically; categorised into groups according to the gender, ages and occupations. However, exploring each groups definitions done by think box, you can see that there are more demographic and psychographics points in there. Here are three groups:

Women

In this grouping the sites says that Drama and Soaps are key drivers of the viewing against this audience (C2DE women). This is Psycographic research as this is the opinion and non interest of C2DE women on these genres of TV. Meaning that they are classified as not interest in Soaps and Dramas shows. Here are two more Pycographic research by the website:

  • VoD viewing is at its highest for this audience group on Thursdays, when on average their TV viewing is lowest
  • Whilst watching their TV they are likely to spend more time than their male counterparts’ multi-screening.

These both say the interest that women have in watching TV, first pointer saying that they are more interested in TV on a Thursday mostly like for the programs that are being shown on that day. Second pointer says about women being on more than one screen whilst watching TV, which tells that women must have that feeling of multi tasking even with devices.

demographic

  • C2DE Women watch over the average daily amount of linear TV at 5 hours and 9 mins
  • 16-34 Women watch 3 hours and 1 mins of linear TV a day, 2 hours and 17 mins of this is commercial TV
  • Young women are the most likely group to use a companion screen whilst watching

These are women grouped into their ages, job roles and what they are (e.g. young) with their classified interest in TV. Seems like C2DE women are more interested in TV than 16-34 year old women, reason could be for the time they have available to spend watching TV. Whilst young women are seemed to be only interested in watching TV with their other device with them.

Mum- She would be part of this category as she is not a house wive, she works for social services. Some of the pointers are corrected about her. For example the Psycographic pointers, the one about VoD is very true as she does need to catch up with her drama and soaps that she has missed due to work. It also true that she watches drama and soaps so she wouldn’t be part of the C2DE group as that only for her love for soaps and dramas prgrams but also because she does not apply to being C2DE group. My mum does watch less than 5 hours of TV a day so she wouldn’t be correct in this grouping because of those demogrpahic views and her age. So some of the pycographic pointers were true but the demographic weren’t.

Adult

Demographic

  • Adults watch an average of 4 hours and 2mins of linear TV a day, 2 hours and 38mins of this is commercial TV
  • ABC1 Adults watch 3 hours and 20mins of linear TV a day, 2 hours and 1mins of this is commercial TV
  • 16-34 Adults watch 2 hours and 41mins of linear TV a day, 2 hours and 1 mins of this is commercial TV

These pointers are of what the website say that are the demographic classification for adults as they are grouped/ called either adults (because they are those kind of people), ABC1 Adults (which are types of job role adults) and 16- 34. They are all grouped with their time of interest in TV which are different as they are different categories.

Psycographic

  • Spend more of their time watching TV whilst using other devices than the average adult
  • TV viewing is highest from Sunday through to Tuesday
  • VoD viewing is highest from Friday through to Tuesday with a dip in viewing on Wednesday and Thursdays.

These are just pointers of interest that adults would have with the amount of time they would watch TV, to also having more interest in other device that they would have whilst watching TV.

Mela Bodgan (Best Friend)- from the chart the psycographic and demographic research on the group that Mela falls in is pretty accurate. She would be catergorised in the adult group but to be more specific the 16-34 adults, as she is in that age range (demographic). Looking at the points in the 16-34 Adults, I can see that all of the points are true about her classification. The demographic point says that 16-34 Adults watch 2 hours and 41 mins of linear TV a day, 2 hours and 1 mins of this is commercial TV. This is true, as Mela does watch more than 2 hours of TV whether it is Revenge on E4 or The 100. Young adults unsurprisingly time-shift more than many other audience groups, yet 91.4% is still viewed the same day as the live broadcast. Mela is a student which means her time watching TV shifts various times according in what she has to do (e.g.school work). The only Psycographic point in this section of the Adult grouping says Spend more of their time watching TV whilst using other devices than the average adult. When I’m with Mela and we are watching TV we are both on our phones or tablets/laptops. Meaning that in conclusion the website was correct in the 16-34 adults section of the adult group as all of the points in this sector of the adult group ticks the classification of Mela being part of the 16-34 Adults: two being demographic and one being psycographic.

Children

The group of children only has one specific section which is titled the same and for the ages of 4-15. The Psycographic points it has are:

  • “As they mature their viewing increases and their tastes switch to a broader range of genres.” This says that the interest of children grows more up whilst they are getting older, which means that children nowadays can be seen maturing with evidence of what they are watching compared to what they did watch in the past.
  • Children watch the majority of their viewing live. With this Psycographic point it shows tells that children have more interest in watching a program live than on-demand, which could be that they rather watch programs on the TV and do another things like playing games and socialising on their tablets/laptops than watch programs on-demand.
  • Children watch an average of 2 hours and 4 minutes of linear TV a day. This Psycographic points shows the attention and interest children have in time to watch TV, which shows that they must have other things to do aswell as watching TV like the other two groups (women & adult).

On the demographic side, the point says Unsurprisingly kids TV channels are the main drivers of viewing against Children 4-15yrs, which means that kids children channels are actually pushing those at the age of 4-15 out of watching anything on the children channels. The reason might have to do with them needing to mature (referring to the psycographic point of maturing in age).

Brother- fits in this group as he is in the age range of being a child. The psycographics points are true about him watching over 2 hours of TV as I catch him most times watching Family Guy. He does watch most of what he wants to watch live as he doesn’t really have interest in Catchup unless he has nothing else to do. Whilst he has been growing up, he has develop into more humorist things like he used to only like the Simpsons and now its them and Family Guy.

In total, these types of research are very useful as they can help different media companies find their specific target audience that they want to succeed with their product. From this website I had to see if my three people would fit correctly in the categories was true and agreeable enough, that it’s seen that other media companies can find their audience very quickly.

Plan for investigation on the future of TV

What is the future of TV?

rating

Since social media sites such as YouTube came in 2005, it has been a wonder from the growth of popularity YouTube has, is TV itself getting less interesting for us, and will YouTube become TV. My planning for this reasearch is the following:

Secondary research

  • TV guide: (http://www.tvguide.co.uk/) is one of many media companies that provides listings of programs that are on TV is the weeks & month coming. Show with this website I can gather the information about programs that are on nowadays and whether they still interest the public (primary research).
  • BARB: (http://www.barb.co.uk/whats-new/weekly-top-10?_s=4) This website is reliable to use as it is .co.uk so it’s based in the UK, which is …. From the TV viewings that this website and company provide, I can investigate the comparison in say channels viewings (in total) and the viewings on some of the programs they provide.
  • EY:(http://www.ey.com/GL/en/Industries/Media—Entertainment/EY-The-future-of-television) This company has predicted on the trends that would keep the future of TV going on for longer. I want to see from the six trends they suggest whether they are right. This would be by asking people, whether through questionnaire or focus group.

Primary research

  • Interview: Ask various questions to a TV expert including those who are working in TV, e.g. Director of a TV channel (e.g. ITV). Questions would be on their opinion on TV’s future and what they think should be done if it does go down hill (what needs to be upgraded in TV to keep it going).
  • Focus group: I would grab a load of students/ young people to see how they think TV is going and it’s future as they would be the ones to witness TV’s future whether it stays or disappears.
  • Questionnaire: Would be given to random people from all ages & genders to give a board aspect of different peoples views on the subject of TV and it’s future.

From the primary research there would be results of both Quantitative & Qualitative research. Quantitative being the numerical results of the questionnaires and focus group. And the Qualitative would be the verbal and written responses the focus group or public answers.

How & why market research is important to the creative media industry?

Task –  www.the-numbers.com/chart

s/

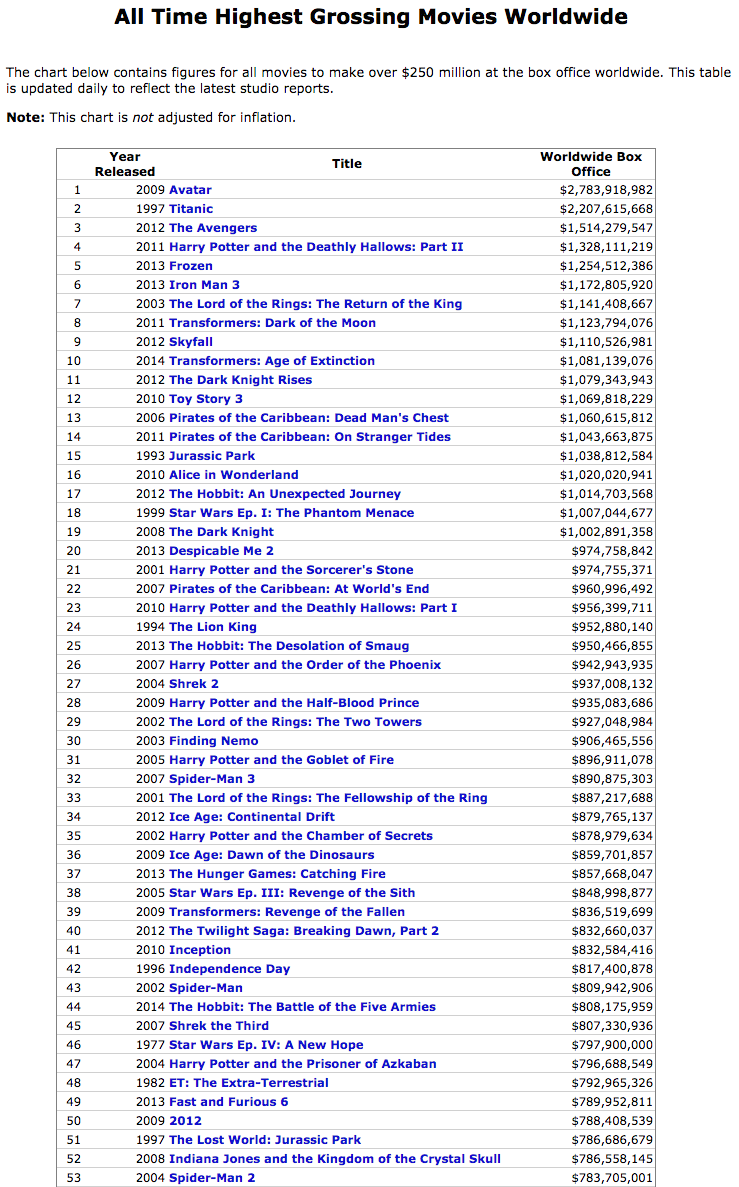
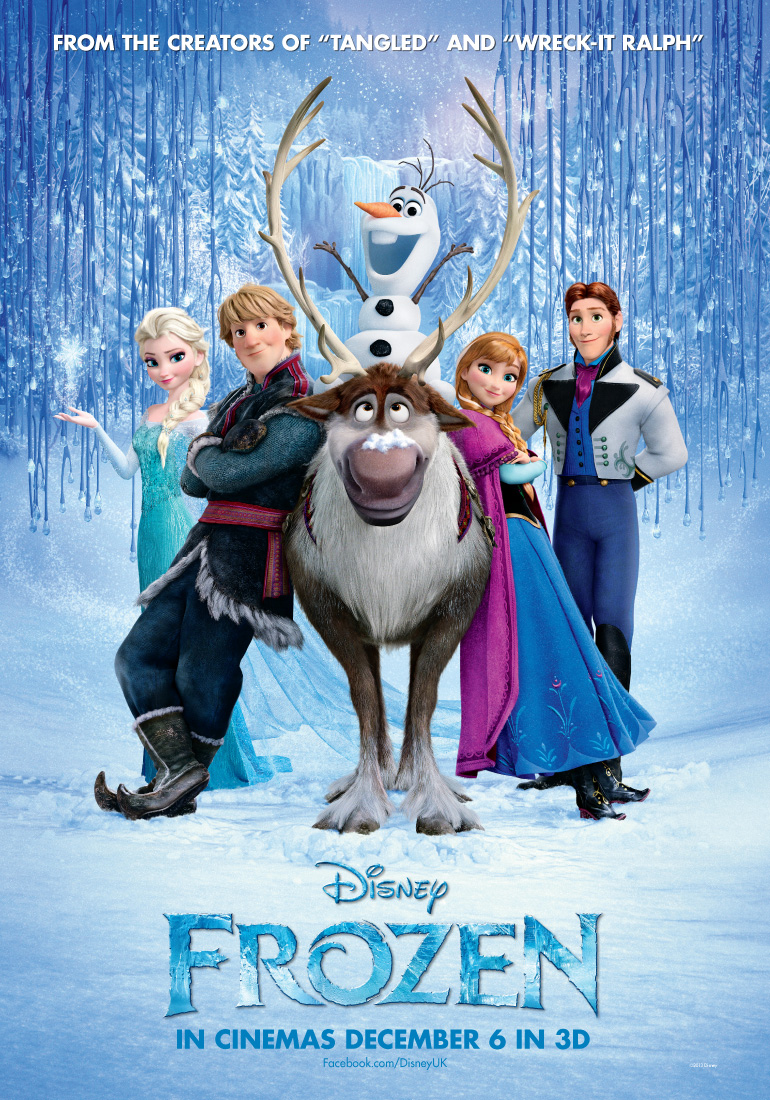
The information that is provided on this site on the ‘international menu’ page is where they give you quantitative information on the profits that films have made. Global films are those which make the most profit in box office as seen on the table. Films like Avatar, Titanic, Harry Potter, Frozen and The Avengers, are all those that get to the audience more, as seen in there profits. The more quantity of people came to see the film (s), the more money in Box office. Things like the narrative (and other film features) or how the marketing and franchise of the film, is how the film gets to the audience.

Screen Shot 2015-01-27 at 14.51.04

To into more detail, from the list in order these are the five top successful earning films from America:

url

titanic

imgres

  • Harry Potter: (Deathly Hallows Part 2 http://www.imdb.com/title/tt1201607/?ref_=nv_sr_2)

Harry_Potter_and_the_Deathly_Hallows_–_Part_2

FROZN_014M_G_ENG-GB_70x100.indd

They all have similar genre taste, even though their main genre would be different, their sub genres aren’t. They all seem to have adventure and drama in their films narrative and structure. With their narratives and structure revolving round those two genres, I can understand now how the profit of the box office of all these five films came to such a large amount. The reason for it is because with these two genres in the structure and narrative of the films, the audience felt more affected by the films, and then more people heard about it, then went to see it, and then more and more profit the film companies got.

In the film  industry there are many rich actors and film creators. However, the most successful ones in profitable are:

1) Steven Spielberg     2) Brad Pitt      3) Hans Zimmer    4)Samuel L. Jackson    5) Johnny Depp

6) Tom Cruise             7) Tom Hanks   8) Adam Sandler  9) Leonardo Dicaprio    10) Morgan Freeman

11) Robert Downey, Jr. 12) John Lasseter 13) Stan Lee 14) Thomas Tull            15) James Newton Howard

16) Will Smith             17)Harvey Weinstein  18) Kathleen Kennedy  19) Angelina Jolie  20) Mark Wahlberg

The thing that is very noticeable on the list is the fact there is only two women in out of the 20: Angelina Jolie and Kathleen Kennedy. This expresses that the film industry is no different to other industries when it comes down to females and males equal pay roll. Some people believe that the unfairness of women getting paid less than men if doing the exact same job role has gone, but seeing from this  list it proves it hasn’t. I think Angelia out of the two females on the list is lucky to even be in the twenties as you can see her husband is second, which means without him being near the top, she wouldn’t be that successful in profit wise without him since he get more than her.

Screen Shot 2015-01-27 at 15.29.47

Seeing from this bar chart of cinema ticket sales there are many patterns in it. First of all, they decrease and increase during the years of 1995 to 2015. Second pattern is the similarities in years. There is a similar pattern to 1996 and 2014, this is where both of them have tickets sold were the same, $1.27 billion. However their revenues are different, 1996 has 5.59 and 2014 has 10.34. They are not the only years that have that, 2009 and 1997 have the same with $1.42 billion but have different revenues which are 2009 has 10.65 and 1997 has 6.51. There are three years that have the same profit price in tickets. 2000, 2005, 2008 all have $1.39 billion, but have different revenues (again): 2000 has 7.48, 2005 has 8.93 and 2008 has 9.95. The fact is from this bar chart you can see that some years get the same in ticket prices but have more revenues, which means doesn’t matter how many revenues there are, it the matter of how the film effects more ticket to be sold.

Another thing that this time all the years have in common is the fact that none of them seemed to hit over $2.00 billion in ticket profits, they all are under $1.60 billion. Meaning either that the profit bar chart is going to carry on with being under $1.60 billion, or one year succeeds to get £2.00 billion or over.

Screen Shot 2015-01-27 at 15.09.35

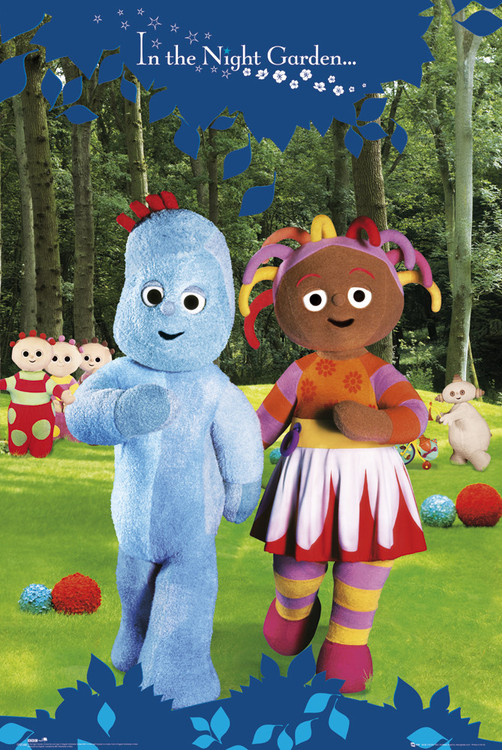
For a filmmaker to make a high amount of profit from the film you create, the most important thing that you should always consider during planning, pre-production and production, is the audience. Even though R rated films are the most that are made for their over 18 audience which is 4,246, the most successful audience members in profit would be PG-13. Not just because they are number one on the table, but it is the reason for that. The fact is considering the films that are meant for this audience are low, they make the most profit in gross: $83,189,412,459. The total of films that are made for this audience is 2,456, but yet they seem to make more money than R and Not rated. The films for Not Rated are a total of 3,199 from the years 1995 to 2014, but are lower on the table because of there average and total gross.

Screen Shot 2015-01-27 at 15.59.38Capture

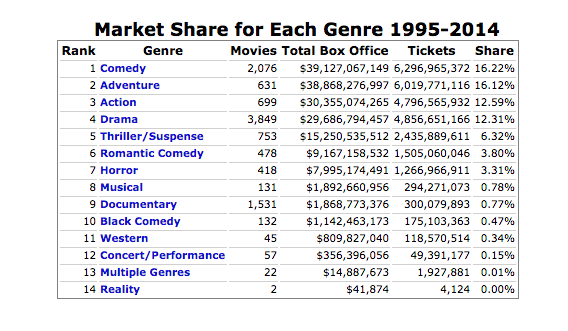
Action and adventure are two of the most successful genres compared to comedy and drama as the two least profitable genres have to produce more films compared to the two top genres. Action and adventure produce less films than the rest which means that their films gather more success with their audience amount, which explains their high amount of profit: more audience members, more money in box office. I think that even though a lot of the genres seem to make a lot of films and end up underneath the two top genre which are action and adventure, the other film genres are successful as they look like they have the money to produce a these films yet still get a descent amount from box office. E.g. Thriller produces 73 films a year and earns $1,143,923,960 which is still a lot for box office profit.

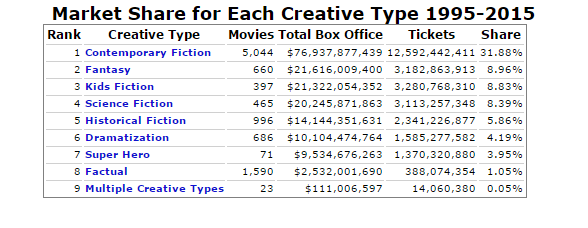
From the creative type table, you can see that what I said before is proven to be correct in that making more movies still gain the genre’s films more profit in box office. Comtemporay Fictions shows the prof, it has made 5,044 films from 1995-2015 and yet has gained $76,937,877,439 in box office profit and sold 12,592,442,441 tickets. Even though this is the top genre in the creative table that makes more films and gets more profit, there are film genres that make a lot of films but don’t get a lot of profit from it, like Factual which makes 1,590 films yet gets $2,532,001,690 in box office. So this table is in support to both my believe in making more films still gets the genre enough profit in box office, and also that least amount of films in a genre gets the genre more money. What this has taught me about marketing is the fact that it is what the audience loves the most about film genres, most of them love action, contemporary fiction and adventure because of the special effects, good looking main actors and etc.

Screen Shot 2015-01-27 at 15.13.41

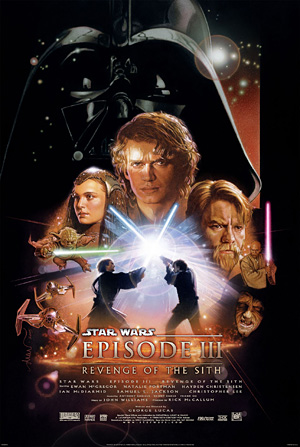
In film there are production ways of creating your film. From the table you can tell that live action is the most profitable in making a film since it makes $142,161,001,132, whilst the least profitable way of making a film would be rotoscoping, making $8,393,627. Here are two examples of films done in each of the production methods:

  • Star Wars: Revenge of the Sith

Star_Wars_Episode_III_Revenge_of_the_Sith_poster

  • Pirates of the Caribbean: the curse of the black pearl

pirates

These two films are said to have been made with the production method of live action which is true as both films do have a lot of action in their scenes. I don’t think I’m that surprised that both films are in the most successful production method. This reason for this is because both films have made a massive success in box office in America alone, that it is from the production method that the films got the huge amount of profit in box office. Star War’s 3rd film got $380,262,555, whilst Pirates of the Caribbean first film got $305,388,685. Proving that the production method helped those two films gain their success in profit.

  • Lady and the Tramp

MPW-50420

  • Alice in Wonderland

alice

These two films were created in rotoscoping production method, and does surprise me as they are two very known films that were popular when released and still are.  Lady and the Tramp made $93,600,000 in box office in America and $5,232,000 was made by Alice in Wonderland in America as well. Both films made a successful amount at the time of their release, but are still part of the production method that is at the bottom of the table. However, it does make since with all four films why they got the amount in their box office. The two that are part of the highest earning production method got more money in box office than the ones that are part of the production method at the bottom.

Screen Shot 2015-01-27 at 15.26.54

In this table you can clearly see three columns beside the most production made films: production budget, Domestic gross and worldwide gross. Production budget means how much the films had spent on making themselves, and domestic gross means the profit made from the film in the made country borders. World wide gross just means the profit made across the world. So with this table is well defined in the difference between profit spent and earned as it includes both the film made origin country profit earnings and the whole world.

The dates of when the films were released is an exception to the table as filmmakers who were to research this would find the differences in the profit that were spent and made during different years, so then they know what to do better than those films. For example, Avatar spent $425,000,000 in production, but got $2,783,918,982 in worldwide gross. If a filmmaker was to discover that then they would need to find out more on how the film was such a success and make a more advance film to make it a successful and profitable film.

The table is in reasonable order as it depends on all three of the columns results. The Avengers spent $225,000,000 on budget but made $1,514,276,457 in worldwide profit. It would of been at the top with Avatar and the Dark Knight Rises, but since it spent less on the production budget it goes down the table. Showing that the table depends on all three columns in order of what the film spent first in budget, then earned in the made country, and last world wide.

The numbers of the amount of money in each three columns are truthful. This is because if you were to see the domestic gross and world wide gross column, then you would see the amount of money is not just ‘0’ after a number to make a million/trillion, they are actual numbers. Say like The Hobbit: An unexpected journey made worldwide profit by making $1,014,703,568, which is believable as it looks more realistic than say if the made exactly “$1,000,000,000”.

In total, market research is very important to the film media production as it gives them information about the two main priorities when it comes to making a film: audience and profit. one with out the other wouldn’t be great for the film that has been made as they both give effect for the film. The more audience members, the more profit the film is going to make. Fro example going back to my research of Top grossing ratings, PG-13 was the highest because of the amount of money the films that were rated and made for that audience, under $84 trillion. See the type of audience does matter if you want your film to gain a lot of money.

It does work the other way round as well, less profit for film less audience members, less gross profit. Take example from the last table, the dark knight rises spent $275,000,000 in production but received $1,079,343,943 in gross world wide, which mean they spent the right amount of money to make the film that effective for the huge amount of audience members that came to see it and get the film production company a massive amount in box office.

Assess the reliability of the following websites

From list of reliability & accuracy, assessing the five websites (https://docs.google.com/spreadsheets/d/1HTQ10qdrcTBwdsfzeg2zI_TIvSTR2BFBa4ByRTHMPzs/edit#gid=0), I have found out the most important factors that should be considering highly when it comes to searching at reliability and accuracy of websites.

  1. Producer of the site: This factor is important as when looking at websites it’s better if it was produced by a recognised source or expert. The reason for this is because of reliability that the visitor would have visiting a website, For example, the daily mail website is recognised as a newspaper as well as the website is just an online version of the articles the newspaper would have. Therefore this is recognised source as for the popular newspaper. BBC Radio Four website is produced by experts as it is part of the BBC TV & Broadcasting network. This means that the reliability on this website would be very trust worthy as the BBC have to maintain high amount of professionalism so then they have to have reliable websites.
  2. Timing: When it comes to websites with facts and events that have happened, they must be updated to the maxim amount of recent facts and things that have had happened in specific events. Wikipedia is one where the timing has to go with the date that is in the present time or have the exact information of subjects updated to the most recent thing that has happened in that subject. Daily mail, Pop Bitch and BBC Radio Four have to keep a daily/weekly update as they are all press/broadcasting media platform that need to keep updating the site with new things as they are establish to give out new feeds about things that have happened. For BBC Radio Four, they put up their recent radio shows on their websites.
  3. Objective: based on facts the only two I would say have sure facts and no opinions on it would be Wikipedia and Buzz Feeds. Reason is because they are both sites that educate their audience with facts and actual information that has been proven or happened. This makes their websites more trustful as they don’t give opinion that some might think is true, when it is not, facts are.

In conclusion, these three factors are import when assessing reliability and accuracy as the audience need to know that they can trust the site and that what they read is the correct information, so they are not mislead to either believing that they are updated with the news or subject, and/or that the information is true.

Understanding the differences URLS

2015/01/img_0856.png

There are many ULRS (Uniform Resource Locator)used throughout the internet for specific websites. Here are three examples:

.edu: .edu is where educational industries such as schools and colleges create websites for others (e.g. parents) to find the their information (http://slang.org/.EDU-meaning-definition). http://www.gse.harvard.edu is one example of an ‘.edu’ website. It is a website for the University of Harvard which contains many information such as facts and figures of the courses they run in the University. The logo of Harvard University is very informative itself as it gives the viewers the knowledge of what University it is and to recognise it. A tool bar that leads you to more information such as news and events that the University has. Information about tuition fee is informative thing that the A University has for its student or future applicants as they would want to know about the cost and fees for the University.

A slide of information e.g.The head teacher of Harvard University shares his opinion of being superintended. This gives the audience the inside of what the Head teacher knowledge is. The website of Harvard also is sociable as they have Facebook and twitter, which keeps the audience that are interested in contact and updated with what Harvard wants to say. There is a search engine for those who are looking for specific information about the university as it might be hard to find. The university’s website also has a lot of pictures to interest and make the website look more entertaining. The pictures are informative as they lead to information say like information about educating immigrant children. Last information that the University has is their own map of where they are located. This is to just inform those who would want to know about the university that it is located on the map.

2

caption one

.gov: is the sort version for the word ‘government’ which means that any site with ‘.gov’ at the end of it, is a government website or a site owned by the government (http://dictionary.cambridge.org/dictionary/british/gov). One government website would be www.tfl.gov.uk, which is because transports is apart of what the government in charge of besides also having Boris Johnson as a big fan of it and being the Mayor of London. The websites provides the target audience of the general public who takes public transport, to plan their with the help of a box which says ‘From’ and ‘To’. This gives the people the chance to find out how to get to their destination quicker.

A tool bar at the top of the page that leads onto more information such as about Fares and payments, which would be useful for most people as they would want to know about the cost of fairs; the cost might be different depending on where they are going. There is also information about train lines and other public transport running. This would help those who travel regularly to know if they need to go a different route. Like the Harvard website there is a search bar to help those who have not found what they are looking for on the website. Pictures are used for the same purpose as those from the Harvard website, as they get the audience attention to see if the information is meant for them. Advertisement is also on this website not only because TFL needs some way of paying for the website, but also to provide information about the other company product or themselves.

38

.com: Is one of the most known urls and has been around since 1985 when the System of Domain Name began its use on the Internet (http://www.verisigninc.com/en_US/domain-names/com-domain-names/what-does-com-mean/index.xhtml). The definition for this url is that it is those websites that would usually have adverts on them; so then they can pay for their website as ‘.com’ is a top domain address that charge for greater one (http://netforbeginners.about.com/od/c/f/What-Does-Dot-Com-Stand-For.htm). For example there is websites like http://www.rosegal.com which is a world-wide online shopping website, which gives the opportunity of signing up not only for the shake of it but for the coupons. This is information for those shopaholic who love discounts and would obviously sign up to get great deals.

A slide of information just like the Harvard university one. With information such as stunning new dresses for 2015, this would inform the target audience of online shoppers that there are new dresses to buy. The tool bar of information leads onto more information. Such as Vintage which has more clothing types and accessories that are vintage. A search engine is also provided like the other two websites that have it, this website has it so then the audience can browse for the right information that they need. The pictures of their products help the audience in getting the visual information of the products and hopefully buying them. They are also sociable like Harvards, so then they can give more information about what they provide.

4

5

79

In conclusion, .gov is the most reliable because everything is factual, websites like TFL are those who give the tru and honest information as they have if not everything can go wrong. edu also realable, the only problem is the fact that teachers or govners can opinionise the website and make it seem prefect. ‘.com’ are more offering on their specific for profit reasons more than helping their customers; the helping gives the company the money.

LAZY TOWN

POSTER

Lazy Town began in 2004, where the actress Julianna Rose Mauriello acted as Stephan until 2007. i.e. http://www.imdb.com/title/tt0396991/fullcredits?ref_=tt_cl_sm#cast . The actress was born on the 26th of May, 1991 in Irvington, New York, USA.i.e.http://www.imdb.com/name/nm1559611/. Besides acting in Lazy Town, Julianna has acted on Broadway alongside actress such as Bernadette Peters. Julianna has studied at a perfomance art school and did dance outside of school.i.e.https://www.youtube.com/watch?v=_jA-8sInjDU.

Stephanie-Julianna

The company that owns Lazy Town is Turner Broadcasting.i.e.http://www.theguardian.com/media/2011/sep/08/lazytown-bought-turner-broadcasting. Magnus Scheving is the creator of Lazy Town and is also known for his speciality in sports as he is a world class althete (links: http://www.imdb.com/name/nm1551787/bio?ref_=nm_ov_bio_sm & https://www.youtube.com/watch?v=67Jo39yD4EA).

To match feature FINANCIAL/LAZYTOWN

Even though I’ve mentioned about the two main characters & actors of LazyTown, there is still to talk about the evil villian that is Robbie Rottern, or to put into real prospective, actor Stefán Karl Stefánsson. Besides acting in LazyTown, Stefán has also done some theatre roles aswell, including acting as Cosmo Brown in Singing in the rain & Puck in Mid Summer Night Dreams by William Shakespeare (i.e.http://www.imdb.com/name/nm1133284/bio)

robbie_rotten_alias_stefan_karl

Since Lazy Town has aired, the target audience has always been children under 7 year olds(http://made-in-iceland.com.cn/creative/ShowArticle.asp?ArticleID=92,https://www.youtube.com/watch?v=unhkqQvM8Ik  & http://kidstvmovies.about.com/od/lazytown/a/lazytownins.htm).LazyTown is shown on the most recongnisable British Children Channel, CBBIES (i.e.http://www.telegraph.co.uk/finance/financialcrisis/7790666/Lazytown-childrens-television-show-becomes-latest-victim-of-Icelands-financial-crisis.html). Besides LazyTown, CBBIES has also broadcasted the popular programmes such as Balamory & In the night garden (http://www.bbc.co.uk/cbeebies/shows). In the UK, childrens programmes are controlled by the company Ofcom. They are a company that handels what can and can not be seen on TV: http://consumers.ofcom.org.uk/tv-radio/television/product-placement-on-tv/.

7237fhOOb9F_balamory_uk-show